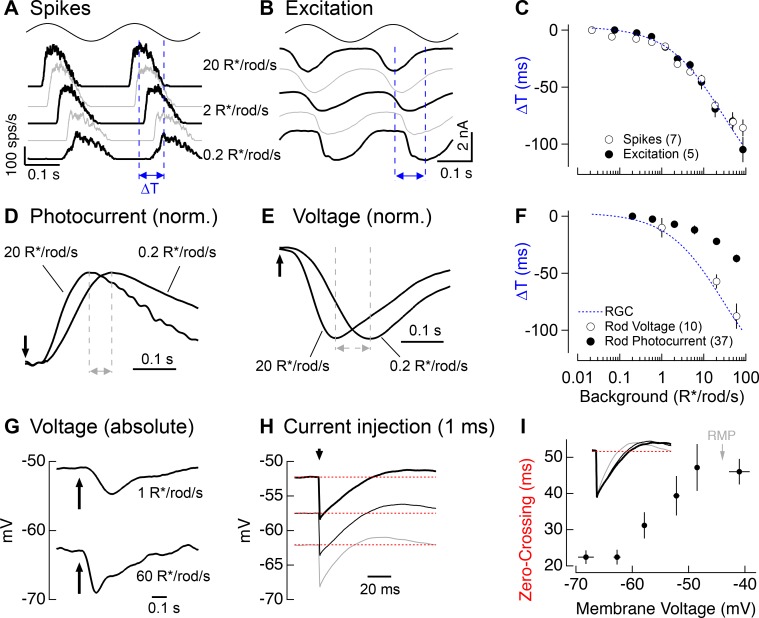
Figure 7. Change in kinetics of rod-derived responses across light levels.
(A) Spike responses to 4 Hz sinusoidal stimuli recorded from an On parasol across a range of rod backgrounds. (B) Excitatory input currents to the same 4 Hz stimuli. (C) Temporal shifts in On parasol responses plotted versus background luminance. The smooth empirical fit to the data is a Hill curve, which is reproduced in F. (D) Recordings of rod outer segment photocurrents in response to brief flashes for two rod backgrounds (normalized). (E) Whole-cell current-clamp recordings from rod photoreceptors to brief flashes for the same two backgrounds as D (normalized). (F) Temporal shifts in rod photoreceptor recordings plotted versus rod background. (G) Exemplary current-clamp recording of a rod photoreceptor responding to a brief flash on two different rod backgrounds. Rods exhibited large steady-state hyperpolarizations as luminance levels increased. (H) Membrane response of a rod to a 1 ms current injection recorded at various physiological membrane potentials. Red dotted lines show bas(I) Measured zero-crossing time of rod responses (n=9) to 1 ms current injections plotted as a function of baseline membrane potential.

