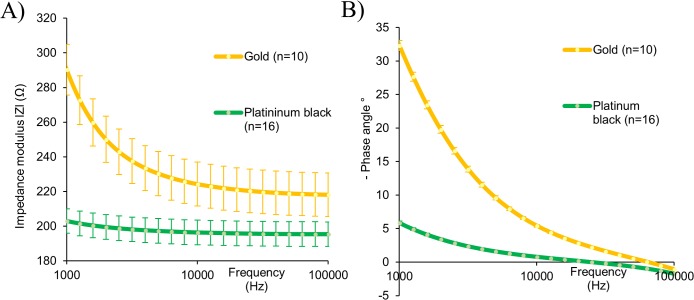
Fig 3. Impedance spectra of gold and platinised electrodes.
(A) Impedance modulus and (B) phase angle. Data captured in EC media and represent the mean ± SEM (gold n = 10, platinum n = 16). Error bars are not visible for phase measurements at the scale used, max gold SEM 0.771° and max platinum black SEM 1.076°.

