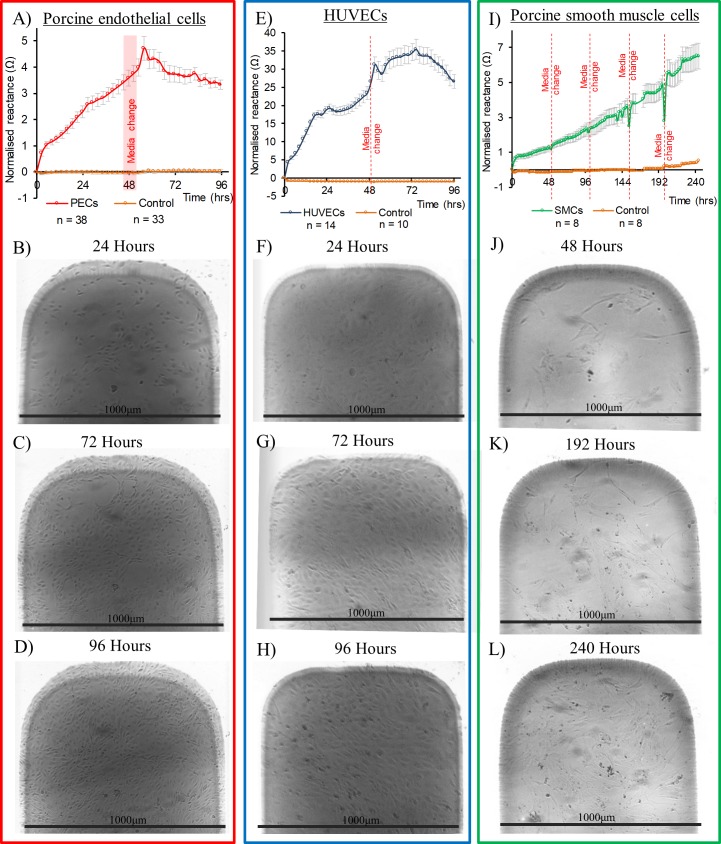
Fig 5. Reactance profiles at 10kHz and corresponding representative light microscopy images.
Light microscopy images for Porcine ECs (B) to (D), HUVECs (F) to (H) and SMCs (J) to (L). Black scale bars are provided by known electrode width of 1000μm. Mean reactance profiles at 10kHz for cell seeded and cell free electrodes (A) Porcine ECs, (E) HUVECs and (I) SMCs. Red lines represent media changes. Error bars are ± SEM.

