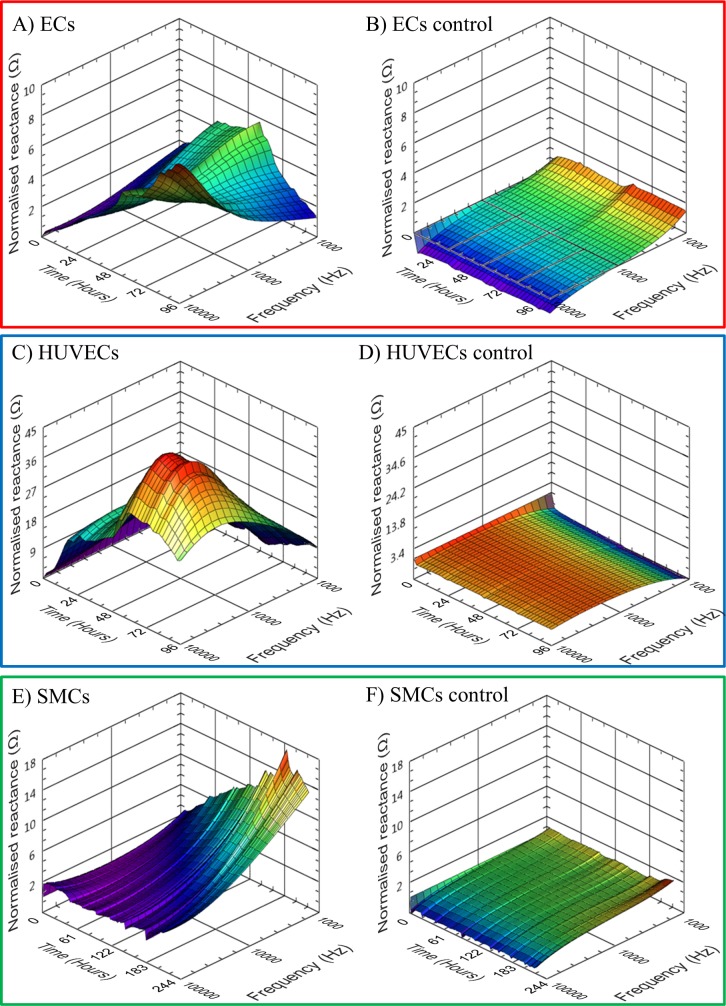
Fig 6. Mean electrode 3D normalised reactance profiles for duration of culture.
(A) ECs n = 38, max SEM = 0.908, (B) EC control, n = 33, max SEM = 0.405, (C) HUVECs, n = 14, max SEM = 3.354, (D) HUVEC control, n = 10, max SEM = 1.054, (E) SMCs n = 8, max SEM = 1.861 and (F) SMC control, n = 8, max SEM = 0.778.

