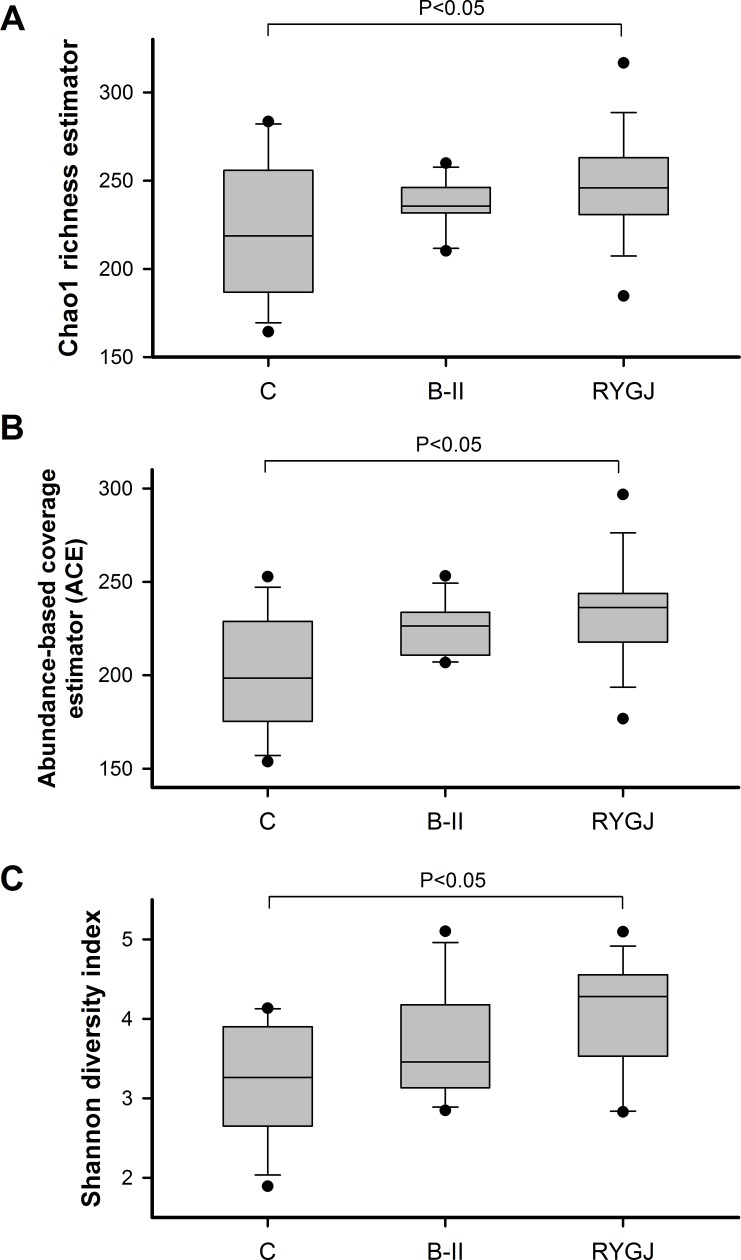
Fig 1. Richness and diversity of gut microbiota in the BII, RYGJ, and control groups.
Chao1 and ACE indexes showed no significant difference in bacterial richness among B-II group and control group (P > 0.05). Chao1 and ACE indices showed significant differences in bacterial richness among RYGJ group and control group (P < 0.05). RYGJ group showed much higher bacterial diversity, as estimated by the Shannon diversity index (SI), in comparison with control group (P < 0.05). There was no significant difference in bacterial diversity among the BII and control groups (P > 0.05). The boxes (containing 50% of all values) show the median (horizontal line across the middle of the box) and the interquartile range, whereas the whiskers represent the 25th and the 75th percentiles. ACE, abundance‐based coverage estimators; C, control; B-II, subtotal gastrectomy with Billroth II anastomosis; RYGJ, subtotal gastrectomy with Roux-en-Y gastrojejunal anastomosis.

