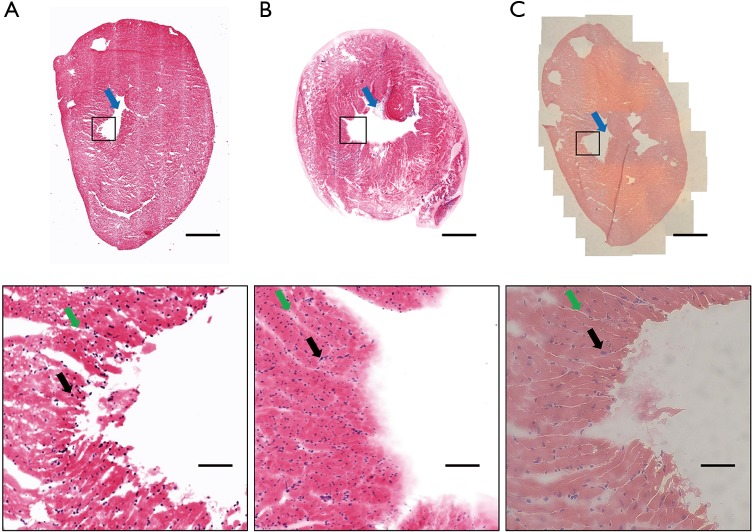
Figure 6.
Mouse heart imaging. (A) Confocal imaging of slide dyed with Hoechst 33342 and eosin; (B) confocal imaging of tissue dyed with Hoechst 33342 and eosin; (C) bright-field image of H&E slide. Black boxes indicate the position of the magnified image. Scale bar (top): 1 mm. Scale bar (bottom, magnified): 100 µm.

