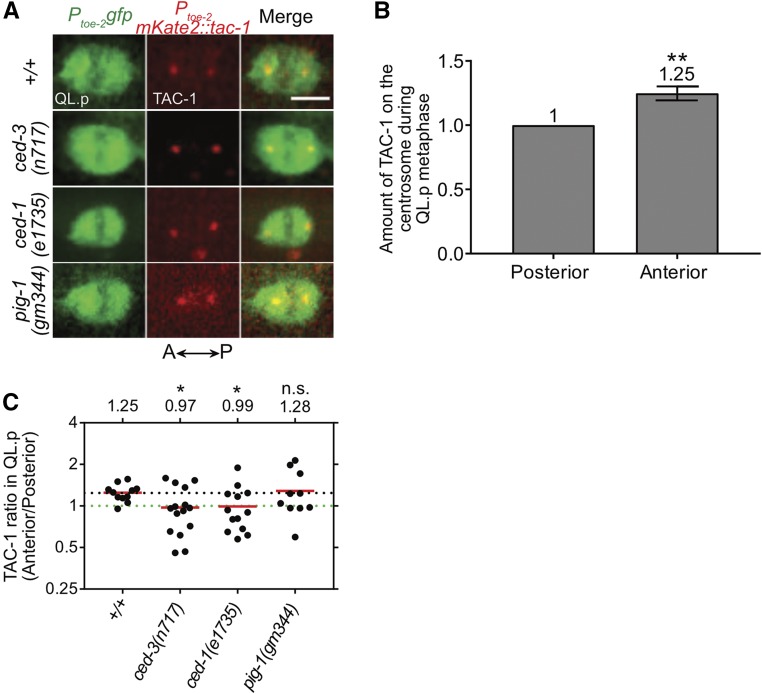
Figure 2.
A ced-1 MEGF10-dependent gradient of CED-3 caspase activity exists in QL.p at metaphase. (A) Representative images of centrosome-associated mKate2::TAC-1 in QL.p at metaphase in the indicated genotypes. Bar, 3 μm. QL.p was identified using Ptoe-2gfp (bcIs133) and TAC-1 was visualized using Ptoe-2mKate2::tac-1 (bcSi82). (B) Bar graph showing the comparison of total mKate2::TAC-1 signals associated with the anterior and posterior centrosomes during QL.p metaphase in wild-type animals. Total “Anterior” TAC-1 signal was normalized to the total “Posterior” TAC-1 signal, which was set to 1 for each animal. Wilcoxon signed-rank test was used to determine statistical significance. ** P < 0.01, n = 11 QL.ps. (C) Dot plot showing the spread of the TAC-1 ratios in QL.p (Anterior/Posterior) among animals of each genotype. The horizontal red lines indicate the mean for each genotype (also mentioned above the spread for each group). The dotted black line represents the mean for wild-type (+/+). The dotted green line represents the ratio 1. Each dot represents the TAC-1 ratio for one animal. Statistical significance was determined using the Student’s t-test and Benjamini and Hochberg multiple comparisons correction. * P < 0.05, n ≥ 10 QL.ps. n.s., not significant.

