Figure 1.
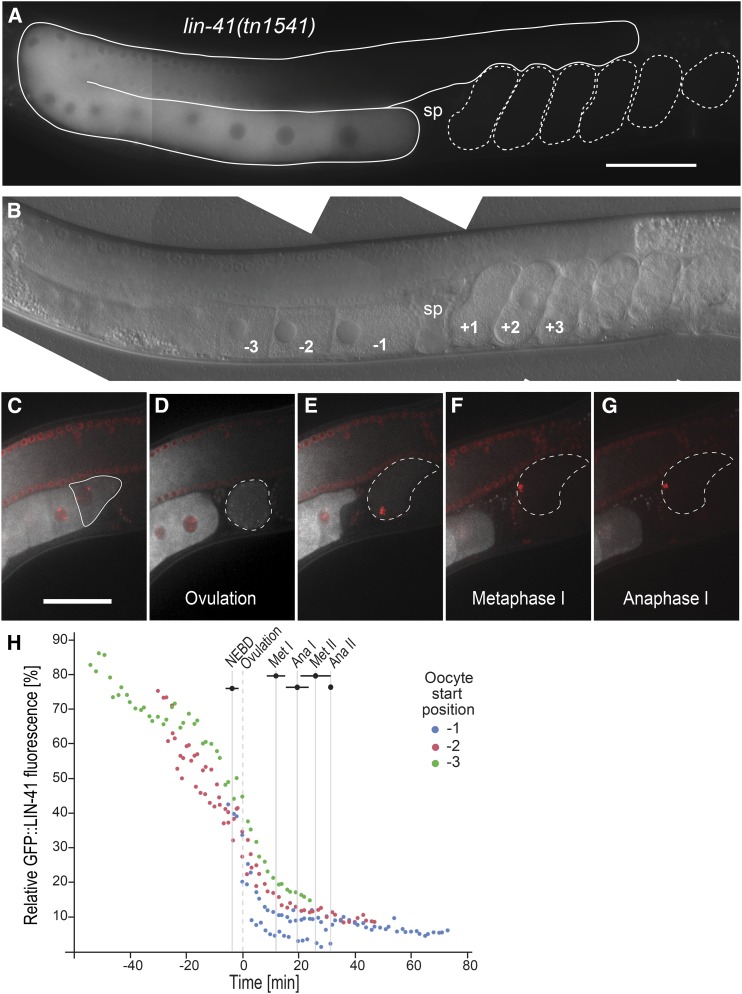
GFP::LIN-41 is eliminated during the first meiotic division. (A and B) Composite GFP (A) and DIC (B) images of a lin-41(tn1541[gfp::tev::s-tag::lin-41]) adult hermaphrodite. GFP::LIN-41 is apparent in the middle and proximal regions of the germline (solid outline, A), with reduced levels in the −1 oocyte immediately adjacent to the spermatheca (sp). The positions of some embryos (dashed outlines, A) and oocytes are indicated relative to the spermatheca in B; a fertilized embryo in the spermatheca would be at the zero position. These labels and naming conventions are used throughout. 100 ms GFP exposures; Bar, 50 μm. (C–G) Time-lapse images of GFP::LIN-41 (white) and mCHERRY::HISTONE-labeled chromosomes (red) were acquired in a living lin-41(tn1541); itIs37[pie-1p::mCherry:::H2B::pie-1 3′UTR, unc-119(+)] adult hermaphrodite by confocal microscopy. Images are shown for select time points (t) prior to meiotic maturation (C, t= −4.5 min), at ovulation (D, t = 0 min), and during the first meiotic division (E, t= +4 min; F, t = +11.8 min; G, t= +16.9 min) as an individual oocyte (C, solid outline) progresses from the −1 to the +1 position and through the OET (D–G, dashed outlines). Bar, 50 μm. Movie S1, worm 1, shows the complete time-lapse series from which the still images were taken. (H) Five oocytes were imaged as they progressed from the −1 position through meiotic divisions; the relative amount of background-corrected GFP::LIN-41 with respect to distal oocytes is shown on the graph at each time point. Three of the oocytes were also imaged at earlier stages as they moved from a more distal location [−2 oocyte (red) or −3 oocyte (green) position] into the −1 oocyte position (blue), as indicated. Timing on the x-axis is relative to ovulation (t = 0). Bars indicate the SD for different meiotic events. Ana, anaphase; Met, metaphase; NEBD, nuclear envelope breakdown.

