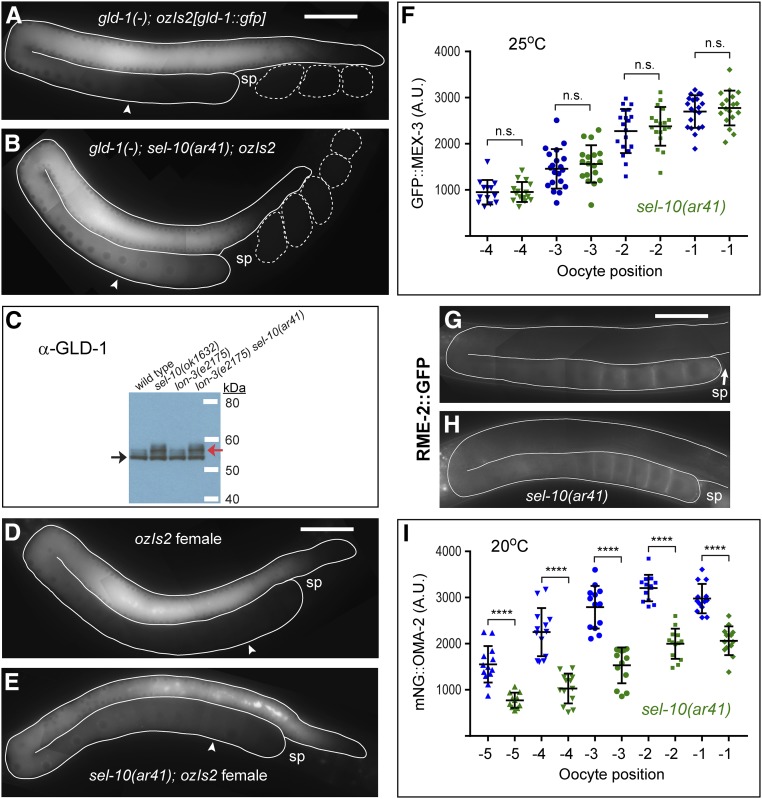
Figure 7.
GLD-1 persists at elevated levels in the oocytes of sel-10(ar41) mutants. (A and B) Composite images of GLD-1::GFP in gld-1(q485); lon-3(e2175); ozIs2[gld-1::gfp] (A) and gld-1(q485); lon-3(e2175) sel-10(ar41); ozIs2[gld-1::gfp] (B) adult hermaphrodites. GLD-1::GFP levels remain elevated in the proximal oocytes (e.g., −4 oocytes, arrowheads) of sel-10(ar41) animals (B) relative to controls (A); 17 ms GFP exposures, brightened slightly. (C) Slow-migrating forms of GLD-1 (red arrow) are more abundant in sel-10(lf) adult hermaphrodites than in sel-10(+) controls, where the fast-migrating form of GLD-1 (black arrow) predominates. (D and E) Composite images of GLD-1::GFP in fog-3(q470); lon-3(e2175); ozIs2[gld-1::gfp] (D) and fog-3(q470); lon-3(e2175) sel-10(ar41); ozIs2[gld-1::gfp] females (E). GLD-1::GFP levels are elevated in the proximal oocytes (e.g., −4 oocytes, arrowheads) of sel-10(ar41) females (B) relative to controls (A), although this is not as dramatic as in hermaphrodites. A somewhat longer GFP exposure (35 ms, brightened slightly) was needed than in A and B, likely due to the presence of endogenous GLD-1. (F) Quantification of the intensity of GFP::MEX-3 in the proximal oocytes of lon-3(e2175); mex-3(tn1753) and lon-3(e2175) sel-10(ar41); mex-3(tn1753) hermaphrodites at 25°. No significant differences were seen (n.s.). (G and H) Composite images of lon-3(e2175); pwIs116[rme-2p::rme-2::GFP::rme-2 3′UTR] (G) and lon-3(e2175) sel-10(ar41); pwIs116 [rme-2p::rme-2::GFP::rme-2 3′UTR] (H) hermaphrodites at 22°; 300 ms GFP exposures. Neither target of GLD-1 translational repression (MEX-3, RME-2) was strongly or even marginally reduced in expression in sel-10(ar41) oocytes. (I) Quantification of the intensity of mNG::OMA-2 in the proximal oocytes of oma-2(cp145) lon-3(e2175) and oma-2(cp145) lon-3(e2175) sel-10(ar41) hermaphrodites at 20°. Differences in expression were highly significant (**** P < 0.0001), but relatively modest in magnitude. For example, we measured a 37% reduction in average fluorescence in the −2 oocytes of sel-10(ar41) animals relative to the same oocytes in control animals. Statistical tests (F and I) employed an unpaired t-test. The plots show the mean and SD. All phenotypes were analyzed on the first day of adulthood. Bar, 50 μm (A, B, D, E, G, and H). sp, spermatheca.

