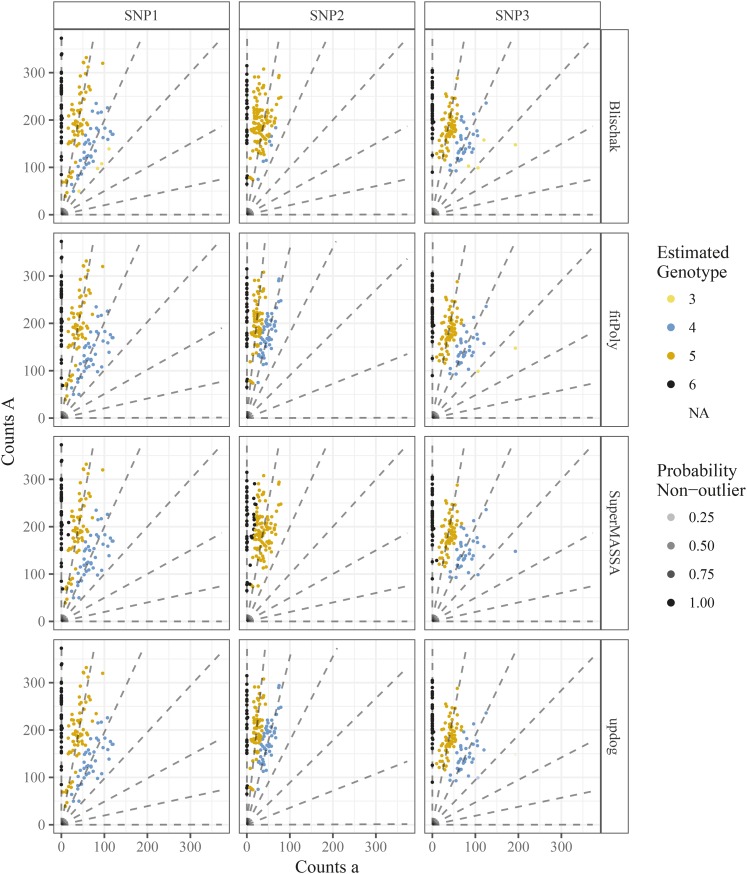
Figure 13.
Genotype plots as in Figure 3 but color-coded by the estimated genotypes from the method of Blischak et al. (2018), method of Serang et al. (2012), and fitPoly (Voorrips et al. 2011), or updog (row facets). The column facets distinguish between the different SNPs. Transparency is proportional to the probability of being an outlier (only for updog).

