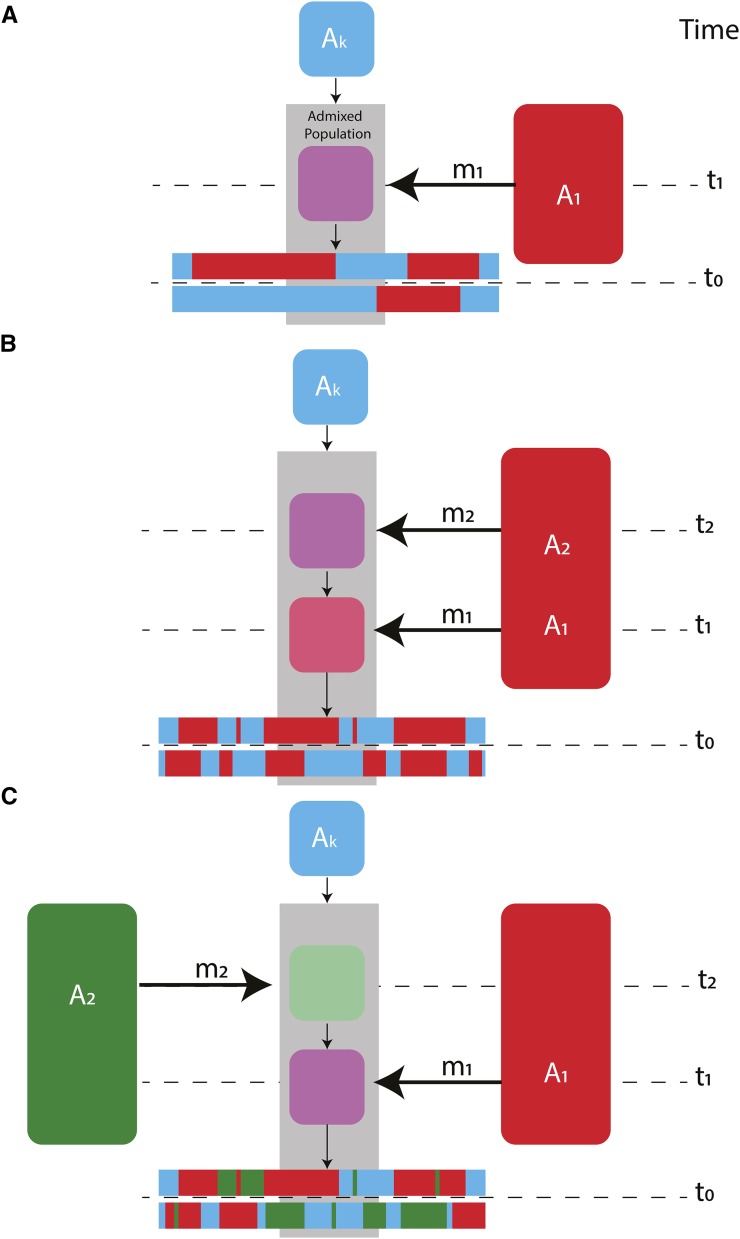
Figure 1.
A schematic of (A) a single-pulse model with two ancestry types, (B) a two-pulse model with two ancestral populations, and (C) a two-pulse model with three ancestral populations. is considered the ancestry type of the resident population and would be in (A) and in (B) and (C). Note that and may come from the same ancestral population, but are modeled as independent states. The gray shaded region draws attention to the admixed population(s). Time since admixture pulses are measured in generations and are denoted as and where occurs more recently than The time of sampling is represented by where if sampling occurred in the present. The proportion of ancestry in the admixed population that entered during an admixture pulse is denoted as and Colors represent genetically distinct ancestry types. Local ancestry across a chromosome after admixture is represented by horizontal bars at the bottom of each subplot.

