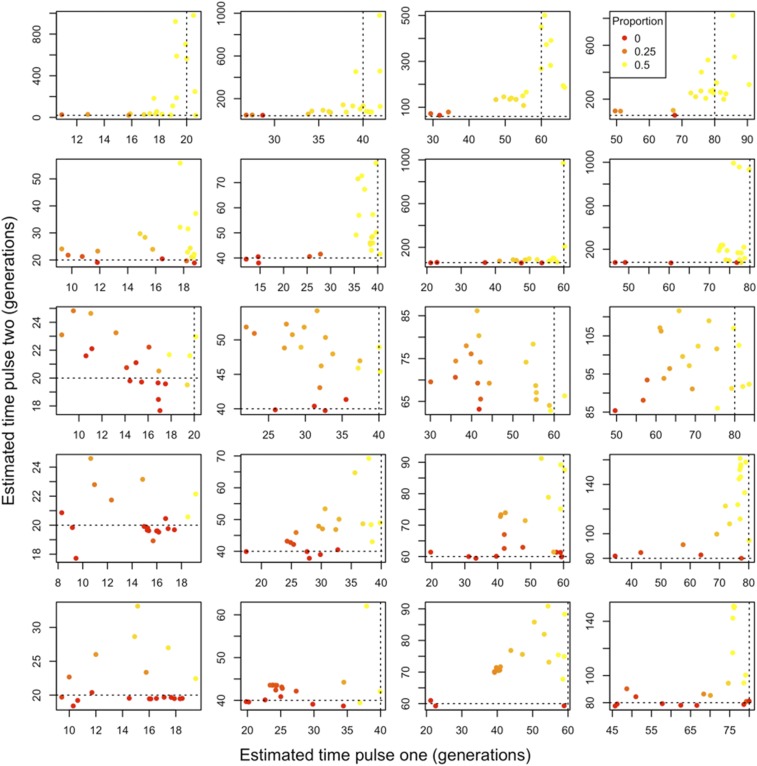
Figure 4.
Two-pulse admixture models fitted using our framework to data generated under a single-pulse admixture model. We considered varying levels of population divergence. From top to bottom, the ancestral populations are 0.05, 0.1, 0.25, 0.5, and 1 Ne generation divergent from one another. From left to right, the single admixture pulse occurred 20, 40, 60, and 80 generations prior to sampling and replaced one half of the ancestry. Point colors correspond to the proportion of ancestry that is attributable to the second pulse, with a gradient running from 0 (red) to the maximum possible, 0.5 (yellow). Dashed lines reflect the true admixture time. Note that axes differ between figure panels.

