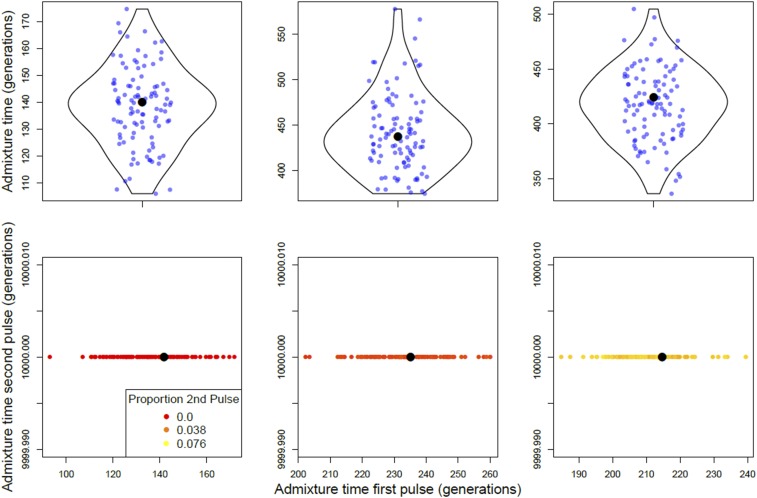
Figure 7.
Single- and double-pulse models applied to real genotype data generated from sub-Saharan African populations of D. melanogaster. In the plots shown, cosmopolitan ancestry pulsed into native African ancestry once (top row) or twice (bottom row). The panels from left to right are populations RG, SD, and EA. Single- and double-pulse models were bootstrapped 100 times. Each point in the top row corresponds to a bootstrap estimate of the timing of admixture. The bottom row shows bootstrap estimates for the timing of the second admixture pulse in backward time. The point colors indicate the proportion of ancestry in the sampled population that entered during the second (in backward time) admixture pulse, with a gradient running from 0 (red) to the maximum, 0.076 (yellow). Black dots indicate the bootstrapped time optima. Note that axes may differ between subplots.

