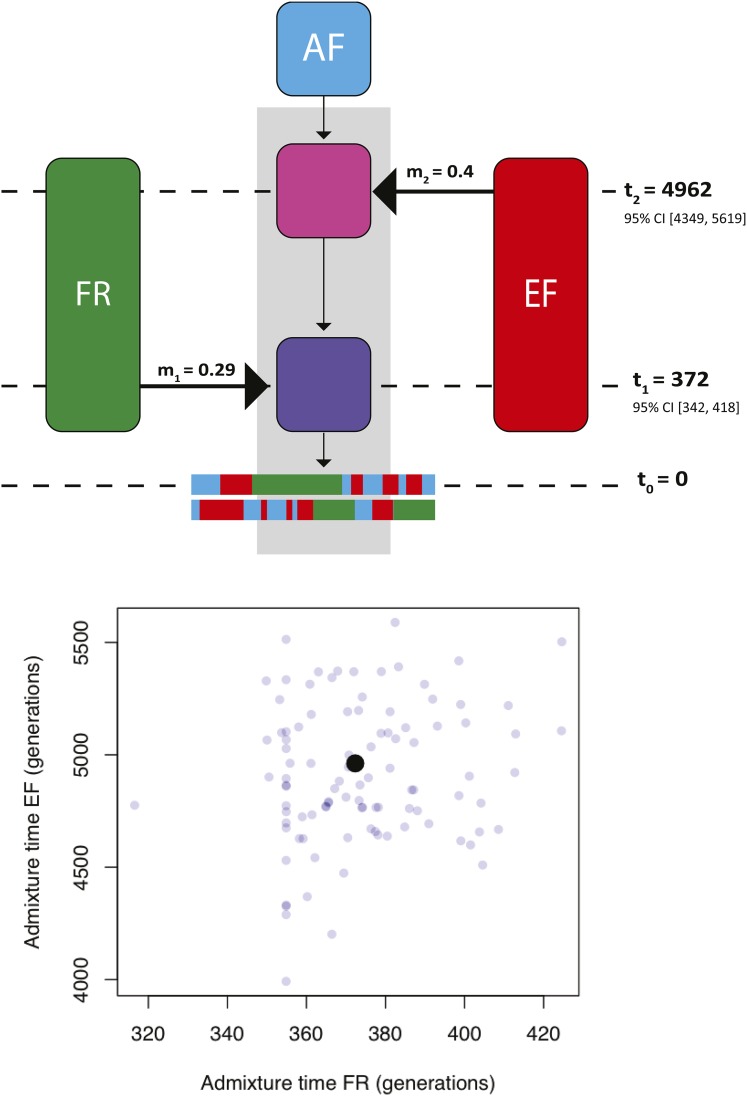
Figure 8.
Most likely admixture model fitted to real data generated from Gambella, Ethiopia (EA). Schematic of double-pulse admixture model with three ancestral populations and ancestry types is shown (top). Note the schematic is not drawn to scale. A total of 1000 bootstraps were run of FR and EA pulsing into AF native ancestry. Real bootstrap data are shown (bottom), where each point is a bootstrap estimate of FR and EA admixture pulses and the black point represents the optimal admixture model from the full data set. The optima and 95% confidence intervals around the estimated timing of admixture are reported as part of the schematic.

