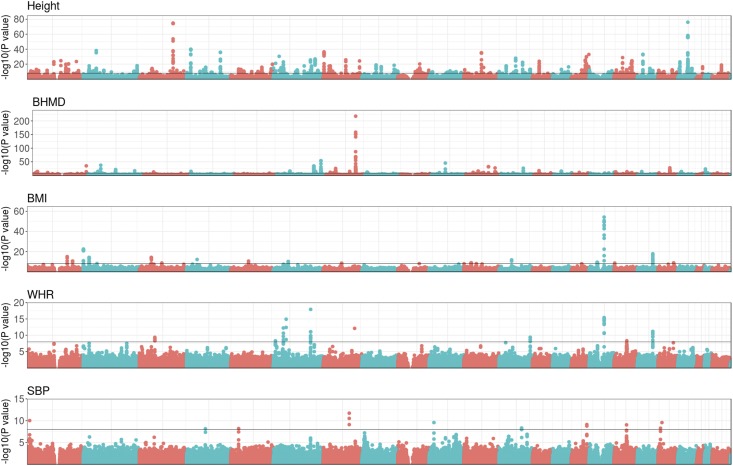
Figure 3.
Genome-wide association study of traits analyzed. Each dot represents the P-value (−log10 scale) of a single SNP. SNPs from different chromosomes are represented by alternating colors, starting with chromosome 1 on the left. The horizontal line indicates the tentative genome-wide significance level (P-value = 10−8). BHMD, bone heel mineral density; BMI, body mass index; SBP, systolic blood pressure; WHR, waist–hip ratio.

