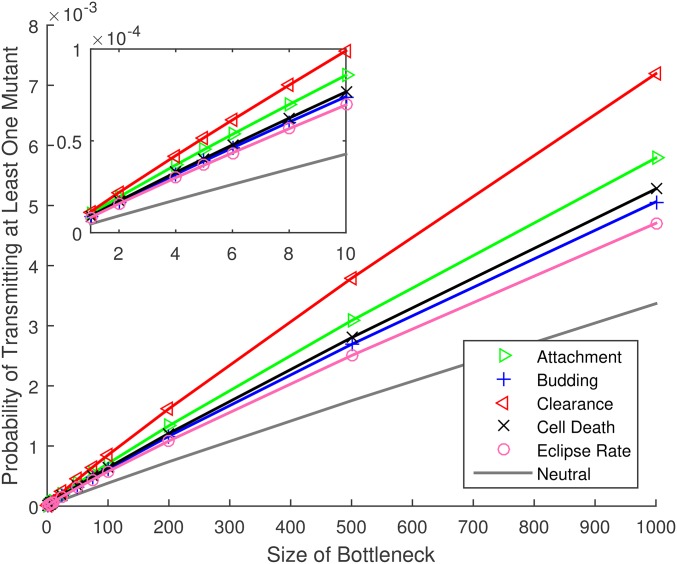
Figure 3.
Probability that at least one copy of a de novo mutation arises during the infection time course and is passed to the next host, for mutations affecting the life history of influenza A virus, vs. the number of virions in the transmission bottleneck. All mutations have a selective advantage of except for the line marked neutral, for which Other parameters as provided in Table 1. The inset shows the same results for small bottleneck sizes. Numerical results [ Equation (4)] are plotted as symbols (per substitution, per site); lines are provided to guide the eye.

