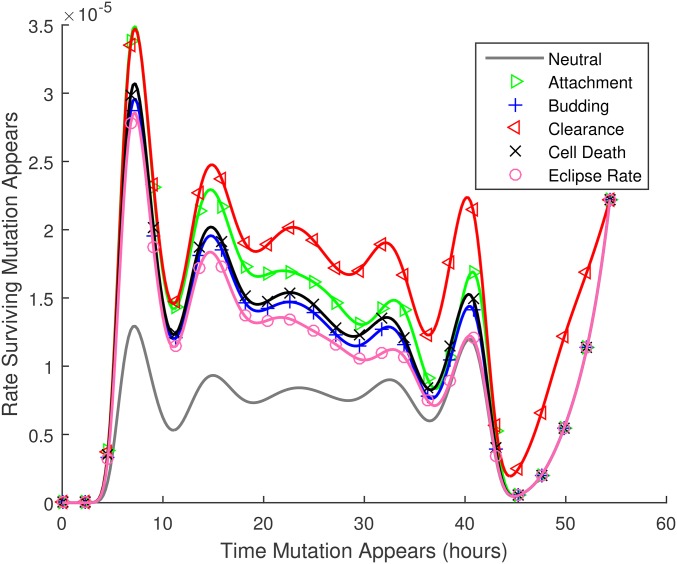
Figure 6.
The rate at which transmitted mutations appear [ν, Equation (3)] vs. the time at which they first appear, For this figure, the probabilities of being passed on to the next host illustrated in Figure 5 are multiplied by the number of new virions produced at each time. Thus the figure illustrates the relative numbers of ultimately transmitted mutations that occur at each time during the infection time course, per substitution, per site. Note that in this figure numerical results are plotted by both lines and symbols.

