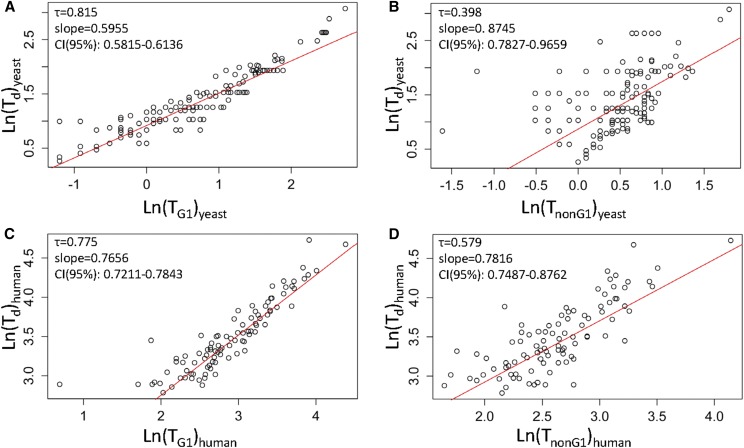
Figure 1.
Linking the length of the G1 phase with population doubling time. Scatter plots of TG1 (A and C) or TnonG1 (B and D) values on the x-axis, against Td values (y-axis). All plots used the natural logarithms (Ln) of the values for yeast (A and B) and human (C and D) cells from Tables S1 and S2, respectively. The Kendall’s (τ) rank correlation coefficient is shown in each case. In red are regression lines of the Siegel repeated medians. The slope and the associated 95% C.I.s of the linear model are shown in each case. Additional statistical parameters associated with these plots are shown in Table 1.

