Figure 3.
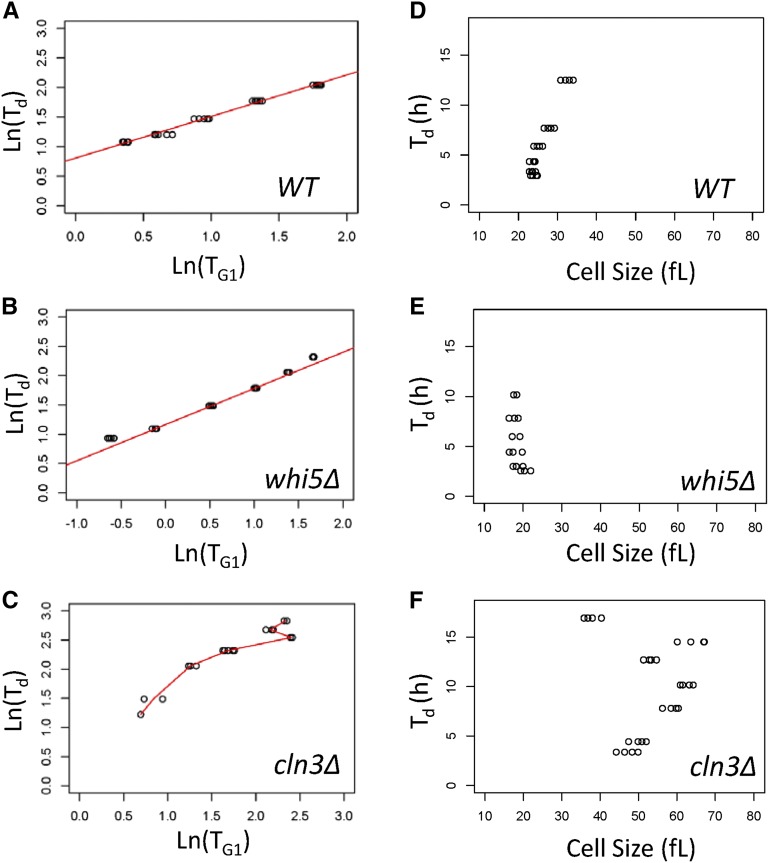
Cln3p, but not Whi5p, imposes the proper relationship between TG1 and Td. Scatter plots of TG1 values on the x-axis against Td values (y-axis). All plots used the natural logarithms (Ln) of the values for wild-type (WT) (A), whi5∆ (B), or cln3∆ (C) cells, sampled from chemostat cultures several times at each dilution rate, as indicated. For WT and whi5∆ cells, regression lines of the Siegel repeated medians are in red and the slope of the linear models are shown (additional statistical parameters are in Table 1). For cln3∆ cells, the red line shown simply connects the average values at each dilution rate. There is no regression line because the relationship between Td and TG1 breaks down, especially at longer generation times. Scatter plots of the relationship of cell size and Td in WT (D) or cells lacking Whip5 (E) or Cln3p (F), with cell size values (x-axis) plotted against Td (y-axis) from the same cultures described in (A–C). All the strains were in the BY4741 background (see Materials and Methods).

