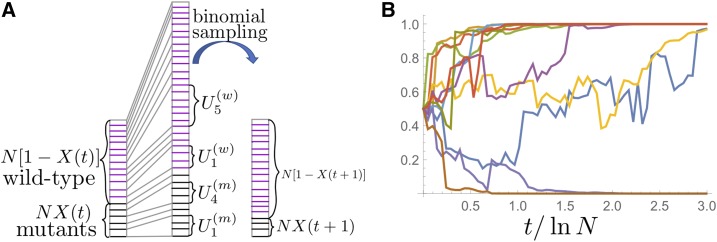
Figure 1.
(A) Illustration of how our model resamples allele frequencies from generation to generation. From a given frequency of mutants in generation t, the frequency of the next generation is produced in two steps. First, each individual gets an offspring number drawn from a given offspring distribution. This step generates random numbers for the mutant family sizes, and for the wild-type family sizes (a couple of large family sizes are indicated in the illustration). After this first step, the total population size will strongly deviate from the starting size N (middle column is much higher than the left column). Thus, we binomially sample with replacement from this intermediate population exactly N individuals (right column has the same size as left column). The resulting fraction of mutants is the mutant frequency in generation (B) A total of 10 sample paths are shown for a population size and an offspring distribution with density All sample paths start with the same initial frequency 0.5. The time axis is measured in units of which turns out to be the coalescence timescale (for large N).

