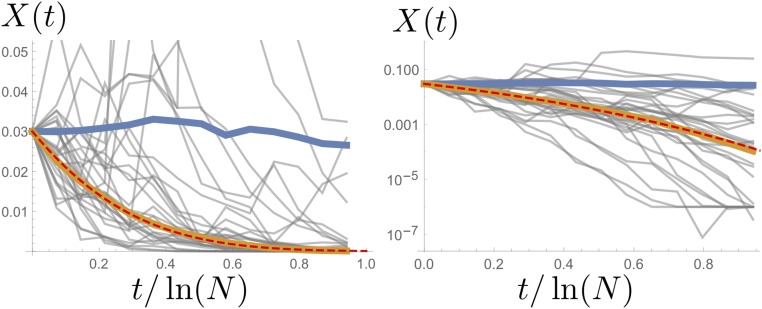
Figure 5.
For a population size of and initial allele frequency 1000 allele frequency trajectories were simulated, 30 of which are shown in gray. The trajectory of the mean (blue) is consistent with the constant expectation, although considerable fluctuations are visible even in such large samples. By contrast, the median (yellow) closely follows the smooth dashed line, which is the behavior expected under frequency-dependent selection with selection coefficient (Figure 4) (ignoring any source of random number fluctuations). The plot on the right is the semilogarithmic version of the one on the left.

