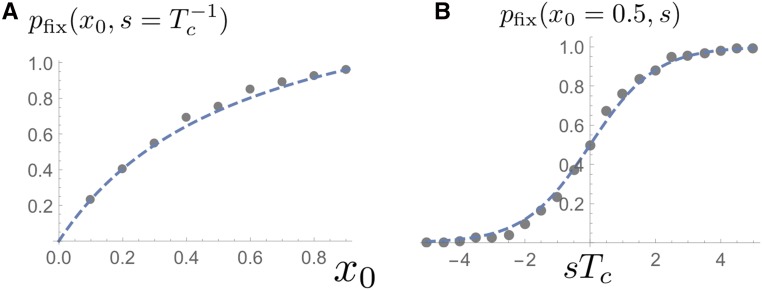
Figure 9.
The probability of fixation as a function of frequency (left; ) and as a function of scaled selection coefficient (right; ). Each gray dot was obtained by collecting 100 fixation or extinction events for a population size of The dashed lines are the theoretical predictions in Equation 16.

