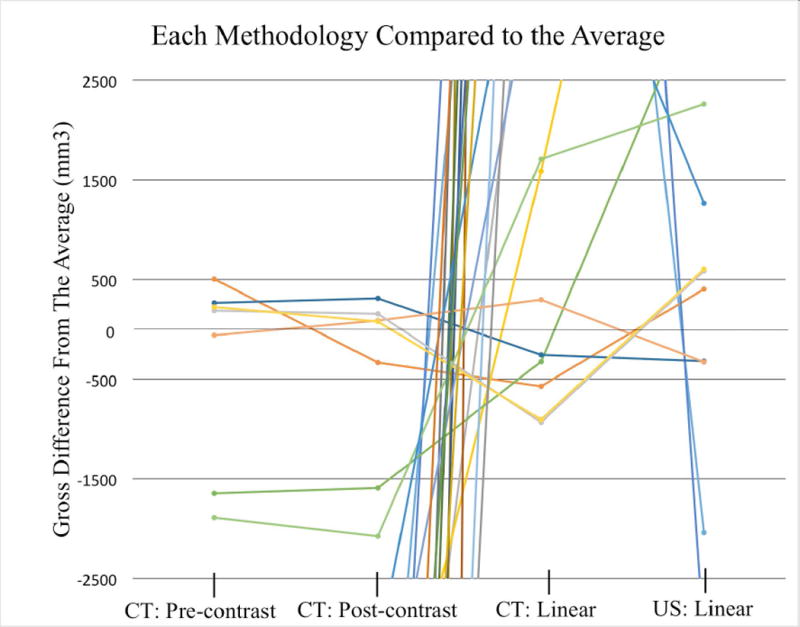
Figure 5.

Line graph displaying the four methods for generating a volume (mm3) as a difference in volume compared to the average of all modalities. The graph is a magnification of Figure 4 centered on the average of the four modalities at 0. The four tumors that had tracing-based volumes greater than the average volumes were near 0 indicating that there was little deviation from the average.
