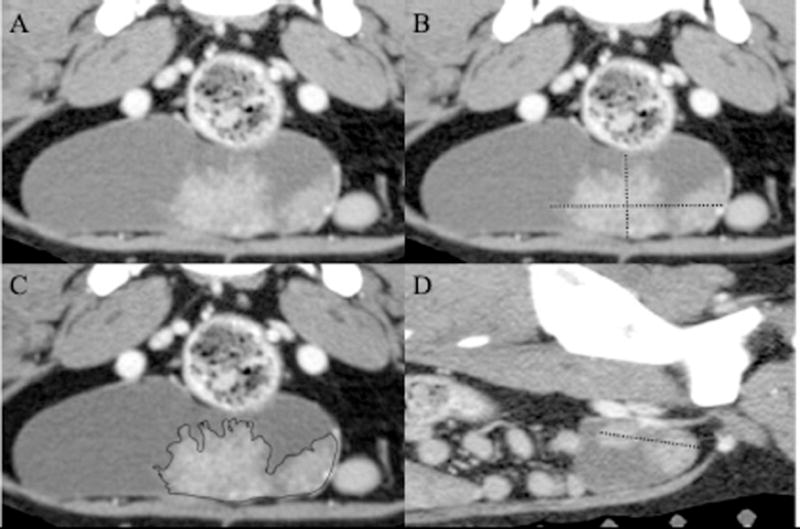
Figure 6.

Post-contrast images of a urinary bladder transitional cell carcinoma along the ventral urinary bladder wall in the transverse plane (A-C) and a para-sagittal plane (D). Figures 3B & 3D show maximum linear measurements for length (3D), width and height (3B) used to calculate volume. Figure 3C is an example of the tracing of the tumor margin on a single transverse image. Calculations based on the linear measurements overestimate the volume of the mass due to the complex shape of the tumor; however, the tracing of the margins more accurately fits the shape of the tumor. For images A-C, the right side of the patient is to the left of the image. For image D, the cranial aspect of the patient is to the left of the image.
