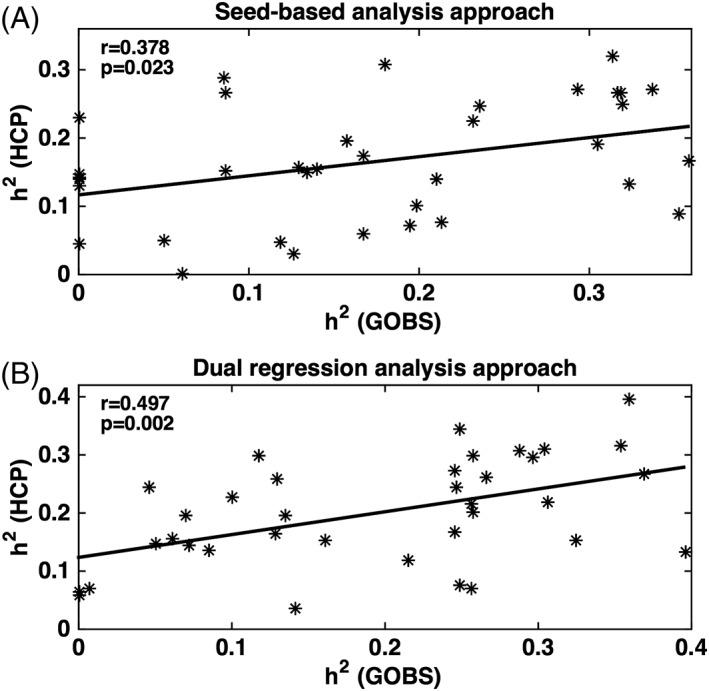
Figure 3.

Heritability estimates for functional connectivity measured in the GOBS are presented as a scatter versus heritability estimates calculated in the HCP cohorts using seed‐based analysis approach (a) and dual regression analysis approach (b). The line represents the result of the linear correlation between two cohorts that reported a positive and significant correlation [r = .378, p = .023 for seed‐based approach (a) and r = .497, p = .002 for dual regression approach (b)]
