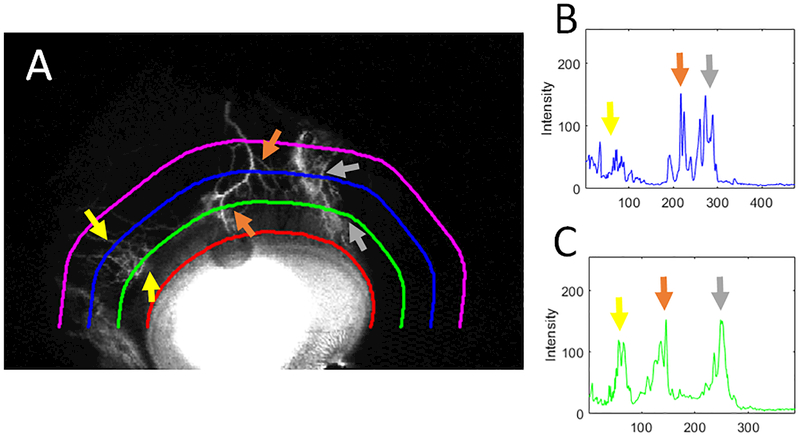
Figure 2.
Quantitative Assessment of Angiographic Signal
A) For each quadrant (here superior), the limbal border was manually delineated (red line). From this, signal intensity was obtained from three test lines (at 15 [green], 30 [blue], and 45 [purple] pixel-increments from the limbus while maintaining the same shape). B) Plotted over its length, the 30-line (blue) shows distinct peaks. C) Plotted over its length, the 15-line (green) shows even more distinct and larger peaks. Thus, the summative signal intensity was determined for all images using the 15-line and compared between quadrants.

