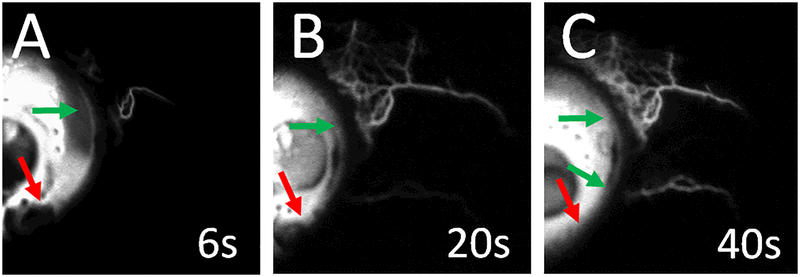
Figure 3.
Fluorescein Aqueous Angiography Signal Development
Subject 1 (right eye; nasal hemisphere) demonstrates increasing fluorescein aqueous angiographic signal (green arrows) over time. Segmental regions of low angiographic signal are also seen (red arrows). White “s” = seconds after tracer introduction.

