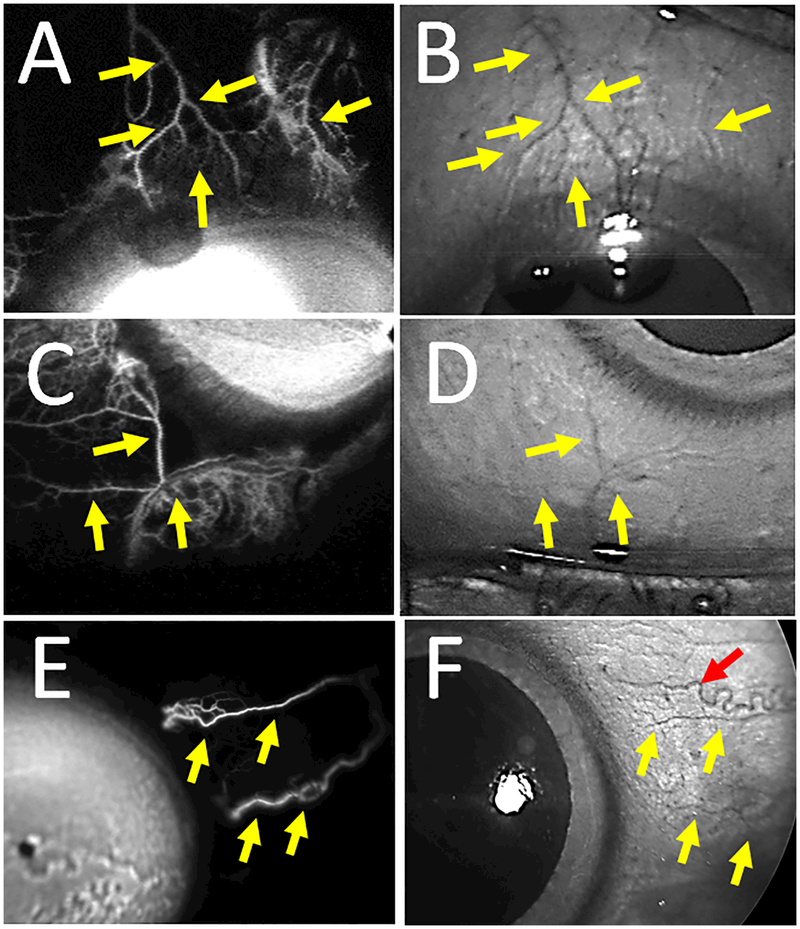
Figure 5.
Fluorescein Aqueous Angiographic Signal Overlaps Episcleral Veins.
A) Aqueous angiographic and (B) CSLO IR images of the superior region of subject 3’s left eye showed overlap between angiographic structures and episcleral veins (yellow arrows). C) Aqueous angiographic and (D) CSLO IR images of the inferior nasal region of subject 3’s left eye showed overlap between angiographic structures and episcleral veins (yellow arrows). E) Aqueous angiographic and (F) CSLO IR images of the nasal region of subject 4’s right eye showed overlap between angiographic structures and episcleral veins (yellow arrows). F) A red arrow points out a corkscrew conjunctival vessel.

