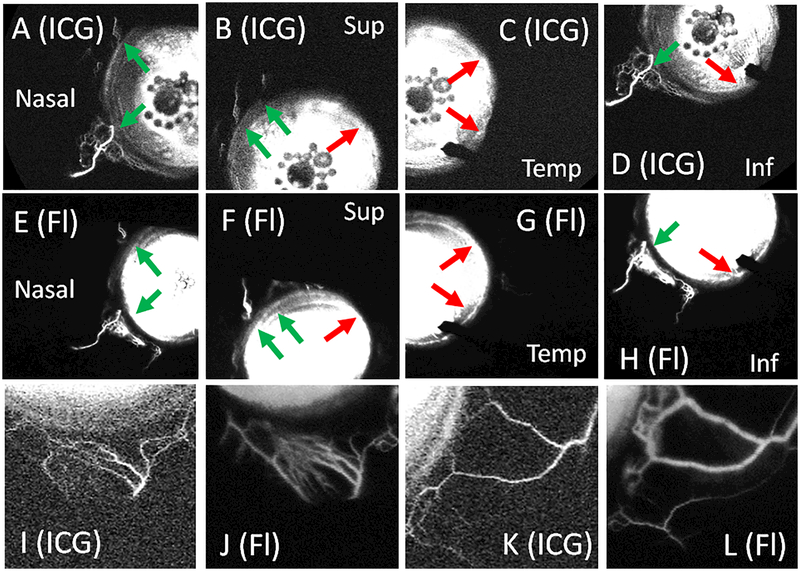
Figure 7.
Sequential Aqueous Angiography using ICG Followed by Fluorescein Demonstrates Similar Patterns.
Aqueous angiography was performed in subject 7 using ICG (A-D) followed by fluorescein (E-H) in the same left eye. (A-D) ICG aqueous angiography showed segmental regions with (green arrows) and without (red arrows) angiographic signal that were similar to the patterns obtained using fluorescein (E-H). ICG signal started at 9 seconds and fluorescein signal started at 4 seconds. A closer view of subject 8’s inferior (I) and nasal (K) regions using ICG also showed similar patterns to that obtained with fluorescein (J and L). ICG = indocyanine green. Fl = fluorescein. Temp = temporal. Sup = superior. Inf = inferior.

