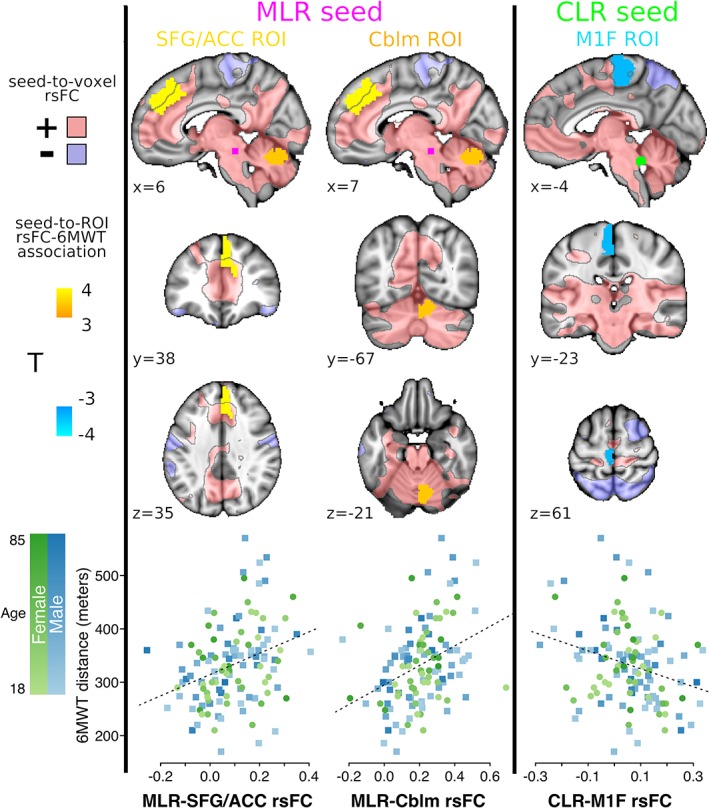
Figure 2.

Primary MLR and CLR rsFC associations with walking capacity (n = 119). Seed‐to‐ROI rsFC significantly associated with 6MWT distance (two‐sided nonparametric p FDR < 0.05), shown in MNI152 space at ROI centroid coordinates. Areas with positive and negative mean seed‐to‐voxel rsFC (|T| > 2) are translucently shown in pink and purple, respectively, with black outlines. The bottom row shows Fisher z rsFC values for each gait‐related rsFC pair plotted against 6MWT distance, with color coding for participant age and sex. MLR, midbrain locomotor region; CLR, cerebellar locomotor region; rsFC, resting‐state functional connectivity; 6MWT, 6‐min walk test; SFG, superior frontal gyrus; ACC, anterior cingulate cortex; Cblm, cerebellum; M1F, primary motor cortex foot area; FDR, false discovery rate
