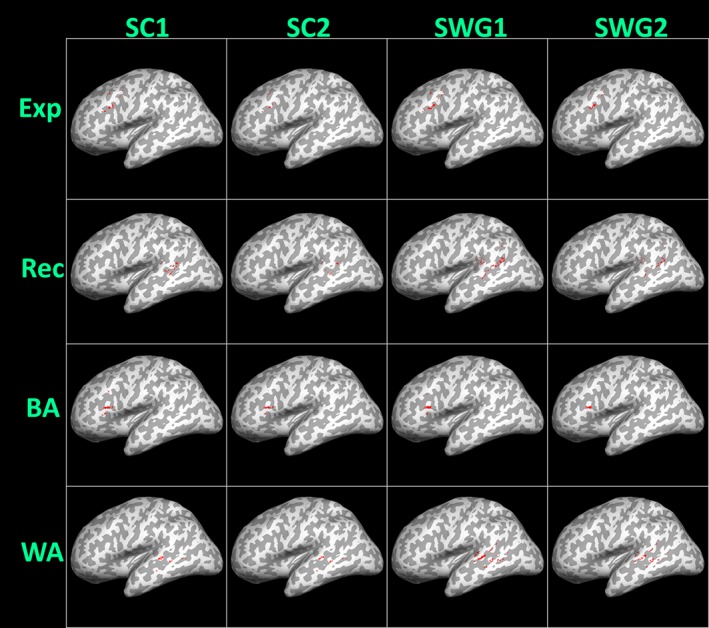
Figure 4.

Left hemispheric threshold‐dependent center of mass (ThD COM), representing the center of mass of 50% AMPLE (activation mapping as a percentage of local excitation) suprathreshold activated voxels from both consecutive runs of sentence completion (SC) and silent word generation (SWG) language tasks, respectively, within the same scan session, is displayed for all right‐handed subjects. Individual subject ThD COM values for expressive (Exp), receptive (Rec), Broca's area (BA), and Wernicke's area (WA) regions of interest are depicted as dots on the 3D inflated sagittal surface of the MNI 2 mm anatomical template. The underlying gyral anatomy confirms the localization of activation areas [Color figure can be viewed at http://wileyonlinelibrary.com]
