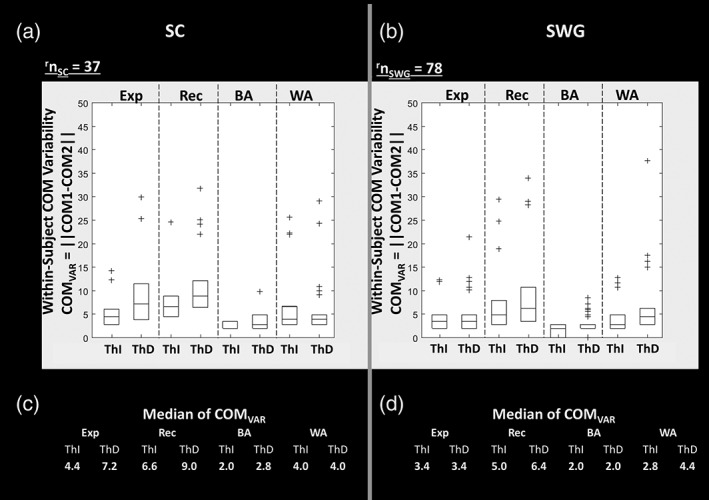
Figure 6.

Within‐subject center of mass (COM) variability COMVAR = || COM1 − COM2|| represents the variability in COM location from run 1 (COM1) to run 2 (COM2) in local regions of interest (ROIs), that is, expressive (Exp), receptive (Rec), Broca's area (BA), and Wernicke's area (WA). COMVAR is referred to as the Euclidean distance (in mm) between COM1 and COM2. The box plots of COMVAR obtained from COM1 and COM2 of left hemispheres across all right‐handed subjects is displayed. On each box, the central mark indicates the median, and the bottom and top edges of the box indicate the 25th and 75th percentiles of distance between COM1 and COM2 across subjects. Those patients with COMVAR beyond 75th percentile are plotted individually using the “+” symbol. The median values of COMVAR (i.e., distance between COM1 and COM2 in mm) across all subjects in each ROI are listed in c and d parts of the figure for sentence completion (SC) and silent word generation (SWG) tasks, respectively; note that these values are <5 mm for both Broca's area (BA) and Wernicke's area (WA)
