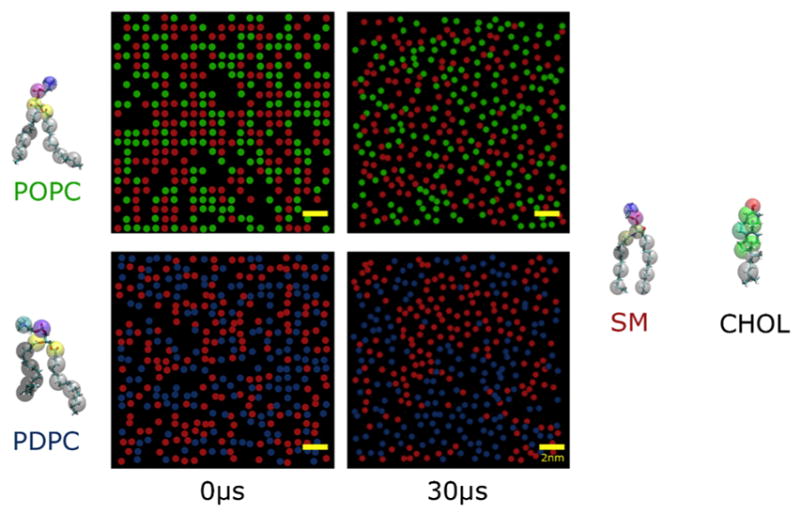
Figure 2. CG MD simulations of POPC and PDPC in the presence of SM/chol.

Top-view snapshots of monolayers of POPC/SM/chol (upper panel) and PDPC/SM/chol (lower panel) at the beginning (t = 0 μs, left column) and end (t = 30 μs, right column) of CG MD simulation production runs. Scale bar (yellow) is 2 nm. Color-coded circles indicate the lateral location of the phosphate head group on SM (red), POPC (green) and PDPC (blue). Chol is hidden to improve image clarity. The CG MD representation of the molecular structure of the lipids is shown to the side of the snapshots.
