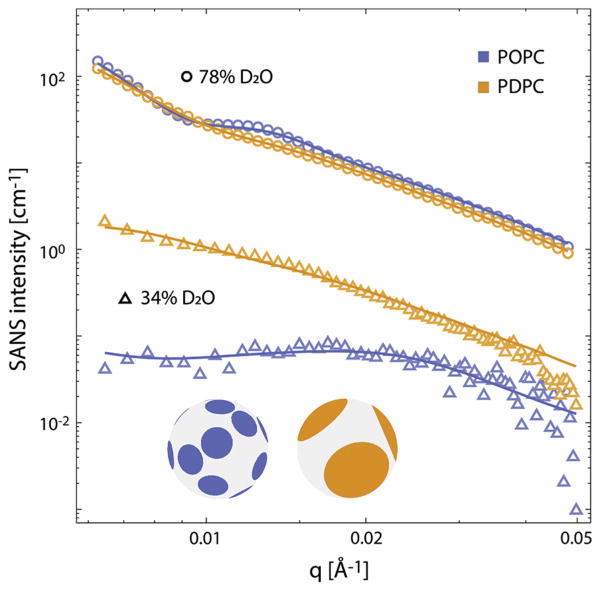
Figure 5. SANS data for POPC and PDPC in the presence of SM/Chol.
SANS data at 20 °C for vesicles composed of POPC/PSM-d31/chol (1:1:0.56 mol, blue symbols) or PDPC/PSM-d31/chol (1:1:0.56 mol, orange symbols), in 78% D2O solvent (open circles) or 29% D2O solvent (open triangles). Solid lines show fits to the data using either a homogeneous form factor for the 78% D2O data, or a laterally heterogeneous form factor for the 29% D2O data, as described in the text and Supporting Information. The inset shows schematic vesicle images corresponding to the average domain structure for the POPC-containing (blue) and PDPC-containing (orange) systems.

