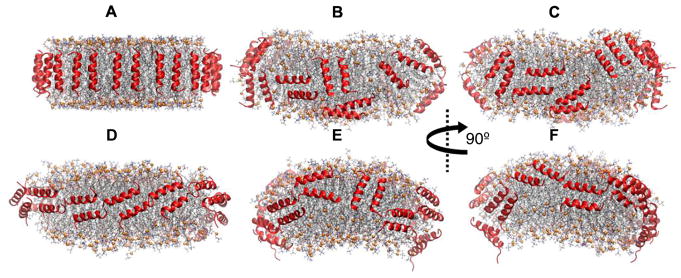
Fig. 10.
Side views of nanodiscs with 200:20:26 POPC:UC:neg showing the disordered configuration of peptides. (A) Simulation 7; picket fence initial configuration (t = 0 μs). (B,C) Simulation 7; t = 2 μs. (D) Simulation 8; belt initial configuration (t = 0 μs). (E,F) Simulation 8; t = 2 μs. Peptides are shown in red ribbons. Lipid representation codes follow Fig. 2.

