
Fig. 11.
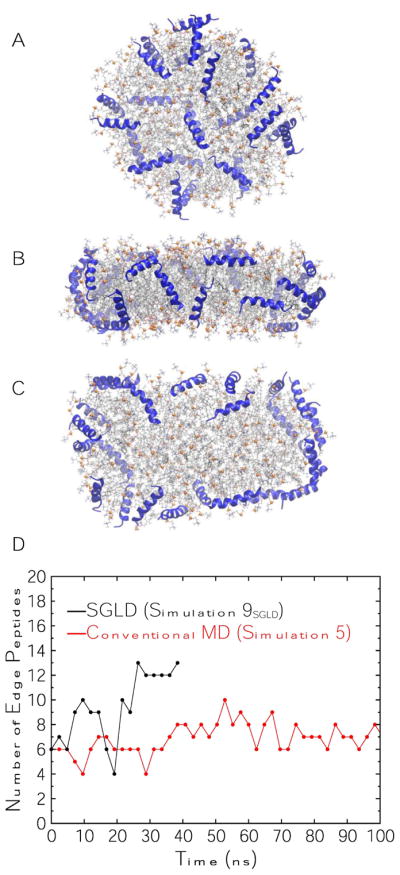
Simulation 9SGLD on 150:15:24 POPC:UC:neu. (A) Top-down view of initial configuration (t = 0 μs); peptides are on disc surfaces identical to initial configuration of Simulation 5. (B) Side view at t = 40 ns. (C) Top-down view at t = 40 ns. Peptides are shown in blue ribbons. Lipid representation codes follow Fig. 2. (D) Time series of the number of peptides on disc edges in Simulation 9SGLD and Simulation 5 (time series of Simulation 5 is truncated at 100 ns for clarity).