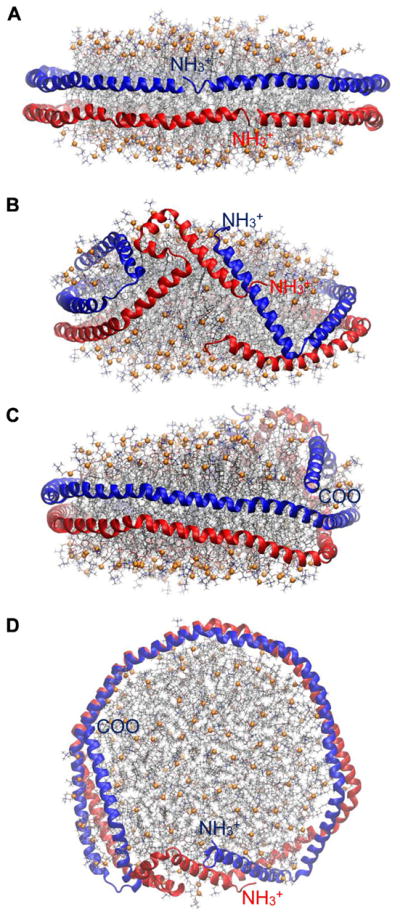
Fig. 2.

Structure of APOA1 in 160:24:2 POPC:UC:APOA1 [35]. (A) Side view at t = 0 μs facing terminals. (B) Side view at t = 20μs facing terminals. (C) Side view at t = 20 μs facing residue 121–142 (helix 5). (D) Top-down view at t = 20 μs. Proteins are shown as blue or red ribbons, and phosphorus atoms of lipids in orange spheres. Other lipid atoms are in stick representation (oxygen, red; nitrogen, blue; carbon of POPC, sliver; carbon of UC, black).
