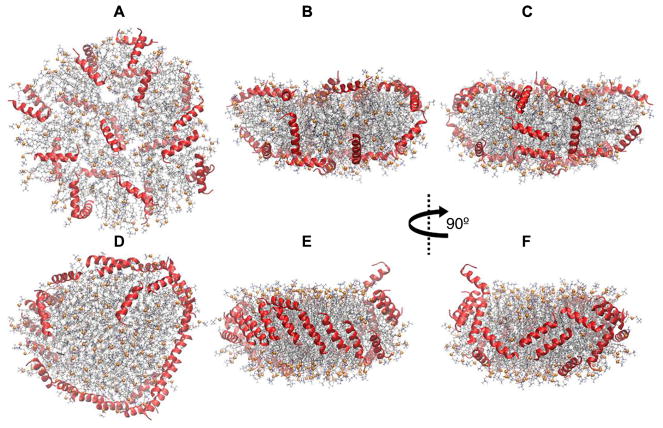
Fig. 8.
First and last configurations of Simulation 5 on 150:15:24 POPC:UC:neu. (A–C) Initial configuration (t = 0 μs); peptides are on disc surfaces. (D–F) t = 3 μs. (A) and (D) are top-down views, and the rest of the panels are side views. Peptides are shown in red ribbons. Lipid representation codes follow Fig. 2.

