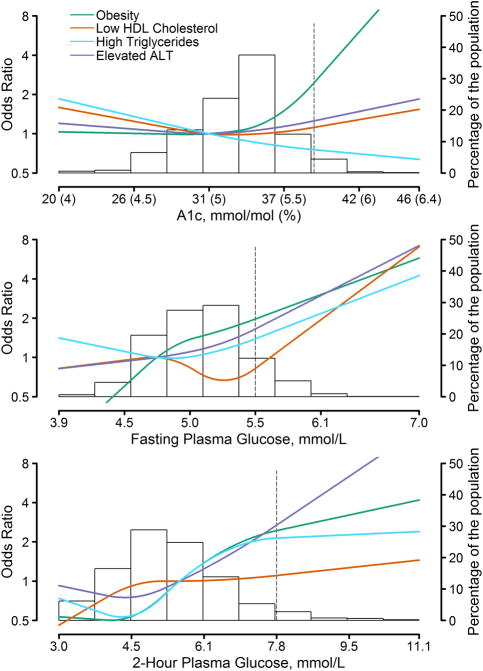
Figure 2.
Adjusted relative odds of obesity, low HDL-cholesterol, high triglycerides and elevated ALT by HbA1c (upper), fasting plasma glucose (middle) and 2-h plasma glucose (lower). Background histogram of the glucose marker is displayed on the right-hand axis. The prediabetes cut-off point for each marker is indicated by a dashed line. ALT, alanine aminotransferase; HDL, high-density lipoprotein. 2005–2014 National Health and Nutrition Examination Survey.

