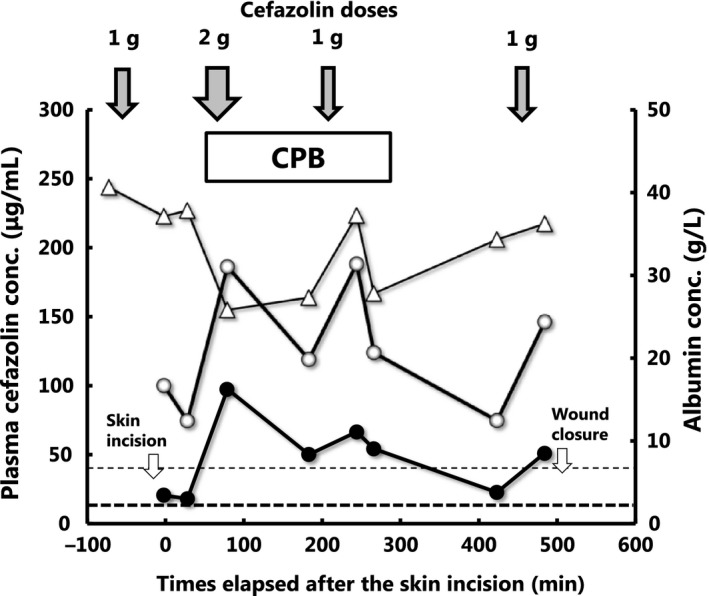
Figure 2.

The time courses of plasma concentrations of total (○) and unbound (●) cefazolin (left vertical scale) as well as plasma albumin concentration (∆) (the right vertical scale) in a representative patient. The fine and bold horizontal broken lines represent target thresholds for total (40 μg mL−1) and unbound (8 μg mL−1) cefazolin concentrations for a representative Staphylococcus aureus strain. Down arrows at the top (↓) represent the doses and times of intravenous administration of cefazolin. The horizontal box represents the duration of cardiopulmonary bypass
