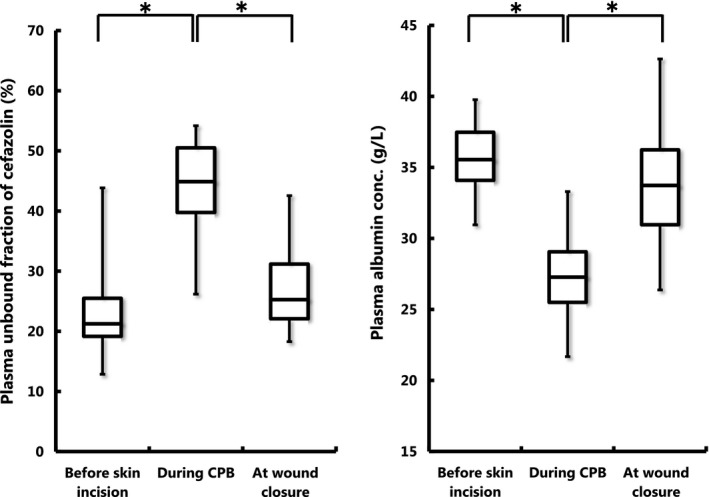
Figure 3.

Box and whisker plots of plasma unbound fraction (%) of cefazolin (left panel) and plasma albumin concentrations (g L−1) (right panel) measured before initiation of CPB, during CPB, and at wound closure. The horizontal bands inside the box represent the medians, and top and bottom of the boxes are 75 and 25 percentile values, respectively. The ends of the vertical lines (whiskers) extending from the box upward and downward represent the maximum and minimum values, respectively. *P < 0.001 between the corresponding median values
