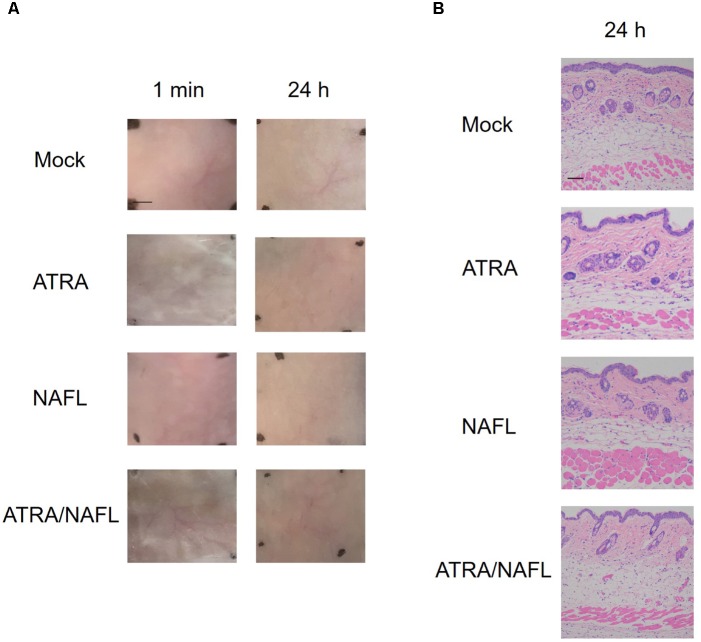
FIGURE 2.
Histology examination of NAFL/ATRA treated skin. Mice were treated with ATRA, NAFL, ATRA/NAFL, respectively. Then the ATRA-treated site was covered with Tegaderm film (3 M) for 4 h. (A) Photos were taken at indicated time points, and representative photos are shown with four mice in each group. Scale bar, 0.5 cm. (B) Representative hematoxylin and eosin-stained sections of the inoculation site 24 h post-treatment. Scale bar, 200 μm.

