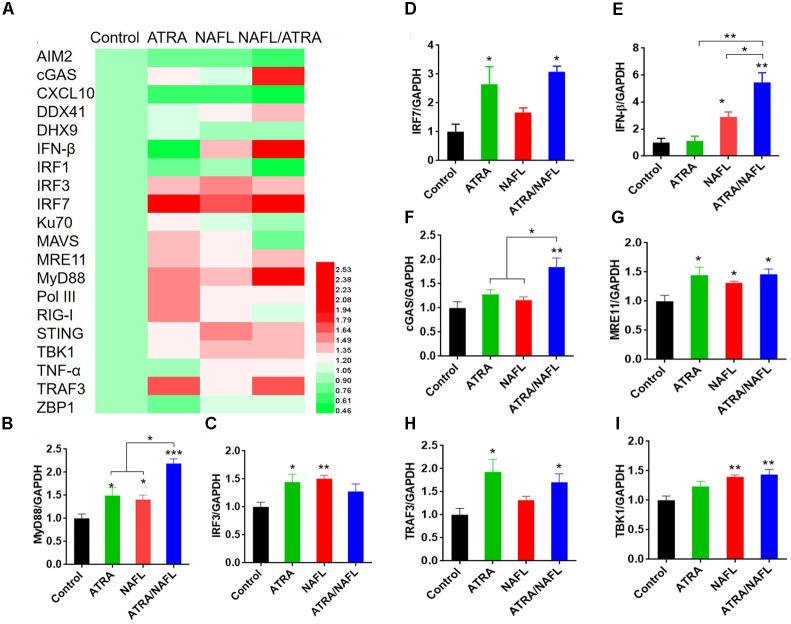
FIGURE 4.
RNA expression level of skin at the inoculation site post-treatment of adjuvants. The lower dorsal back skin of C57BL/6 mice was exposed with ATRA, NAFL (high, 2 hits) and ATRA/NAFL for 24 h; then the skin was isolated, and RNA was extracted for qRT-PCR. (A) Heat map diagram of gene expression level of skin inoculation site. Changes in expression levels are displayed from green (downregulation) to red (upregulation), as shown in the color gradient at the bottom right corner. Rows indicate different genes and the columns represent samples post-treatment of ATRA, NAFL, ATRA/NAFL. Averages of replicates of different groups were shown. The heat map was illustrated using HemI 1.0 software. The mRNA expression level of (B) MyD88, (C) IRF3, (D) IRF7, (E) IFN-β, (F) cGAS, (G) MRE11, (H), TRAF3 and (I) TBK1. N = 4. Data are presented as mean ± s.e.m. ∗P < 0.05; ∗∗P < 0.01 or ∗∗∗P < 0.001, respectively.

