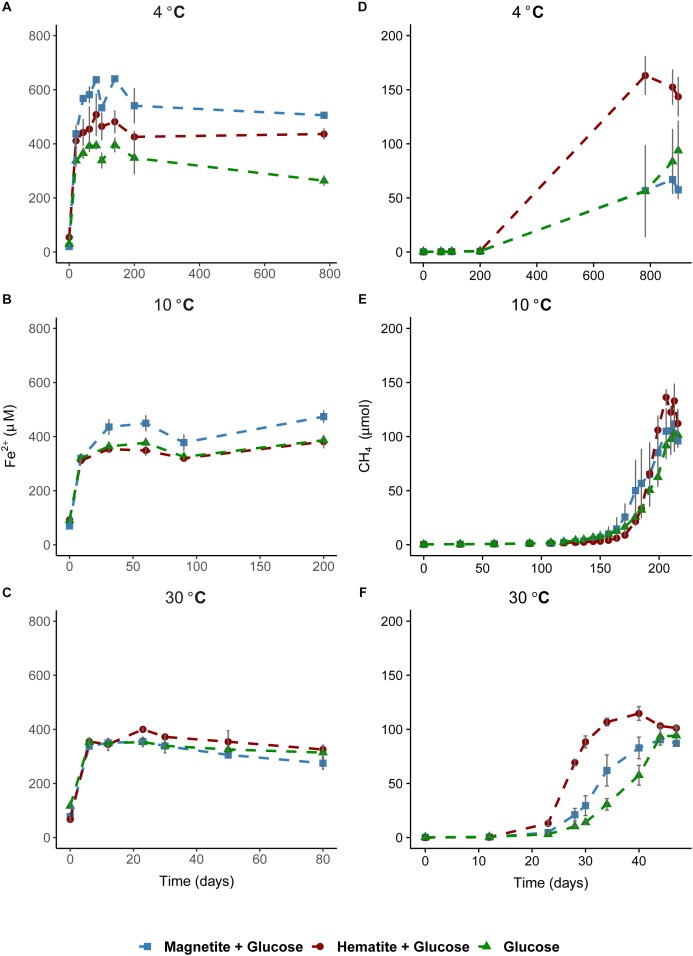
FIGURE 1.
Time course of iron reduction and methane formation in sediment incubations. Left column plots show time course of iron reduction at 4°C (A), 10°C (B), and 30°C (C). Fe2+ was measured over time until a stable concentration was observed in the aqueous phase across all temperatures. Right column plots show time course of methane formation at 4°C (D), 10°C (E), and 30°C (F). In (A), the 800-day time point was added to demonstrate that iron reduction was not on-going in the methanogenesis phase.

