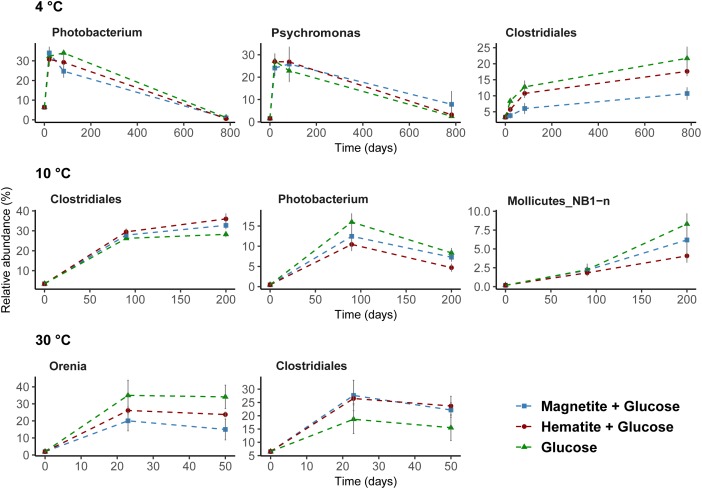
FIGURE 4.
Dominant bacteria communities enriched over time at 4°C, 10°C, and 30°C determined by 16S rRNA gene analysis. A threshold of relative abundance increase of 5% was used to determine key taxa (from order to genus level) compared to controls. Percentages show relative abundance of individual genus or order. Data presented here are reflecting the main bacteria taxa that were stimulated by glucose addition to slurry incubations.

