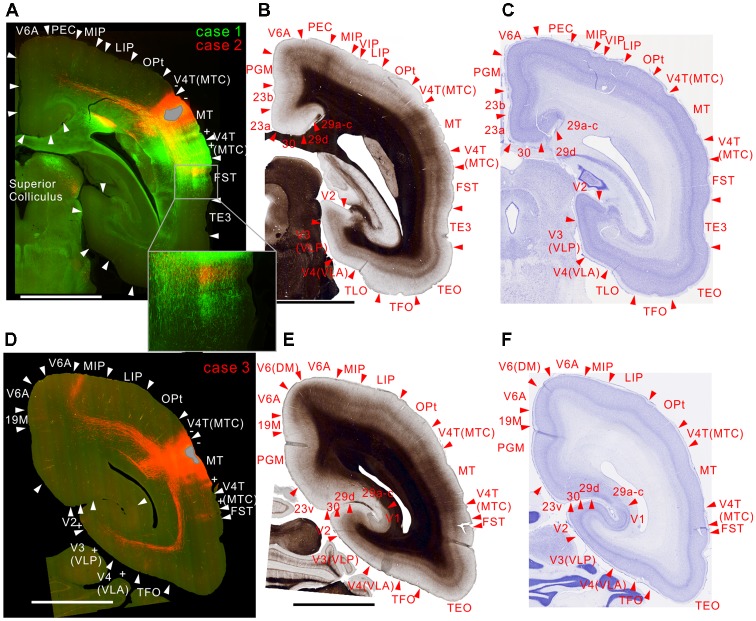
Figure 4.
Brain section images at levels of the injection sites showing projections to intraparietal areas, utilizing the same format as in Figure 2. (A) Fluorescent section image from case 1 (green) and 2 (red). (B) Image of the corresponding myelin-stained section. (C) Images of the corresponding Nissl substance-stained section. (D–F) Images of brain sections from case 3. Inset in (A) is a higher magnification view showing horizontal connection in gray matter. In (A) the centers of the injection sites were slightly caudal from this section, whereas it was slightly rostral from this section in (D).

