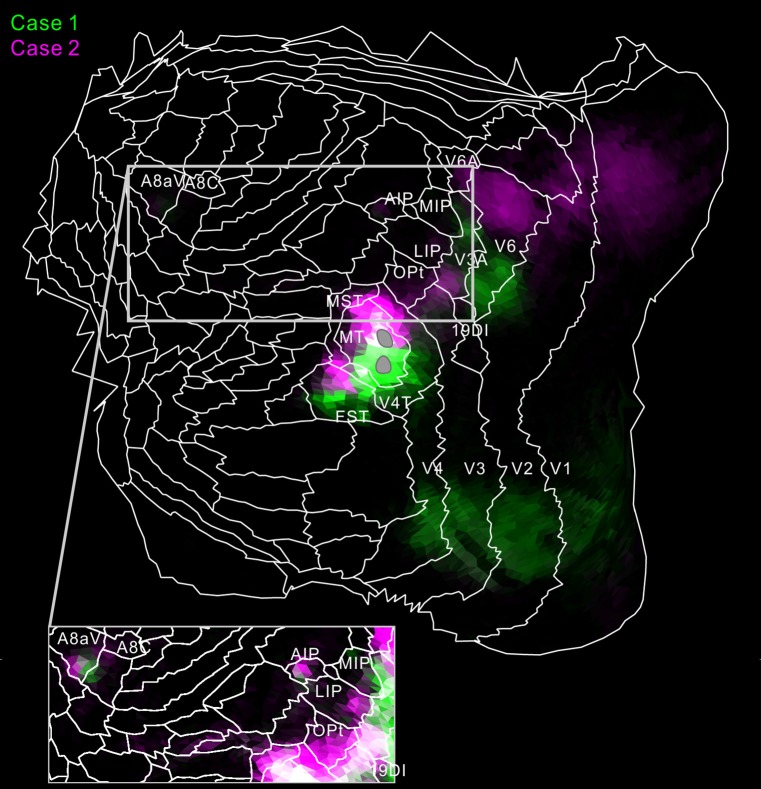
Figure 8.
Flat map showing MT projection in case 1 (green) and 2 (magenta). To increase visibility, magenta, not red, was used for case 2. White regions indicate overlaps of the two tracer projections. The inset shows a part of the flat map in increased brightness. The gray regions indicate injection sites in MT.

