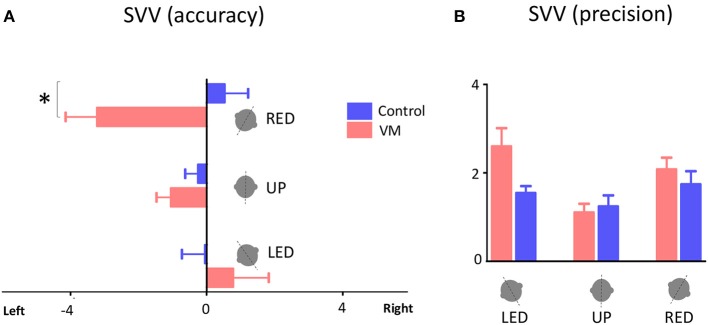
Figure 3.
SVV accuracy and precision. (A) Mean values of SVV accuracy for VM patients and healthy controls with error bars showing standard errors of the mean (SEM). Positive values indicate SVV errors toward the right side, and negative values indicate SVV errors to the left side. The asterisk indicates a significant difference in SVV errors during right head tilt in VM patients compared to controls (p = 0.002). (B) Mean values of SVV precision with error bars showing SEM. LED, left ear down; UP, upright, RED, right ear down.

