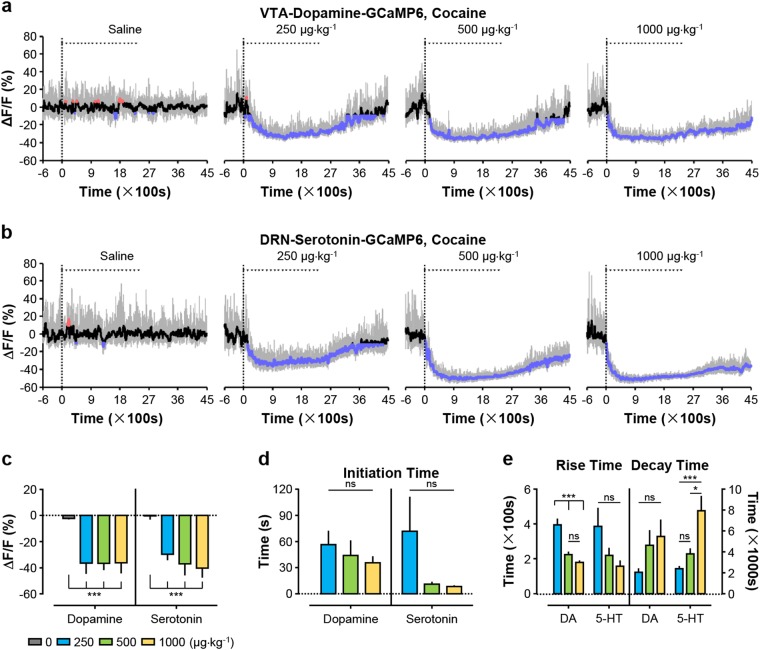
Fig. 3. Cocaine produced strong and prolonged suppression of Ca2+ signals for both dopamine neurons and serotonin neurons.
a, b Representative Ca2+ signals of dopamine neurons and serotonin neurons following cocaine infusion at the indicated doses. c Overall Ca2+ signals during cocaine infusion [n = 7 DAT-VTA-GCaMP6 mice (abbreviated as dopamine mice), F(3, 24) = 50.54, p < 0.0001, one-way ANOVA with Tukey’s post-hoc test; n = 7 Sert-DRN-GCaMP6 mice (abbreviated as serotonin mice), F(3, 24) = 56.53, p < 0.0001, one-way ANOVA with Tukey’s post-hoc test]. d Initiation time for cocaine to inhibit dopamine neurons and serotonin neurons [n = 7 dopamine mice, F(2, 18) = 0.5568, p = 0.5826, one-way ANOVA with Tukey’s post-hoc test; n = 7 serotonin mice, F(2, 18) = 2.446, p = 0.1149, one-way ANOVA with Tukey’s post-hoc test]. e Rise time and decay time of cocaine-induced decrease in Ca2+ signals of dopamine neurons and serotonin neurons [n = 7 dopamine mice; for rise time, F(2, 18) = 22.70, p < 0.0001, one-way ANOVA with Tukey’s post-hoc test; for decay time, F(2, 14) = 2.707, p = 0.1014, one-way ANOVA with Tukey’s post-hoc test; n = 7 serotonin mice; for rise time, F(2, 18) = 2.862, p = 0.0833, one-way ANOVA with Tukey’s post-hoc test; for decay time, F(2, 18) = 10.68, p = 0.0009, one-way ANOVA with Tukey’s post-hoc test]. Error bars indicate the standard error of the mean (SEM) (c–e). *p < 0.05; **p < 0.01; ***p < 0.001; ns not significant

