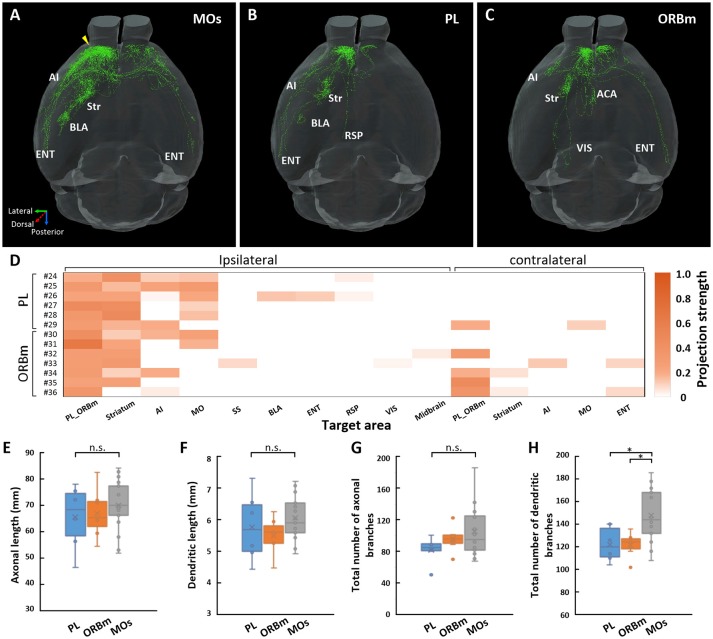
Figure 4.
Projections of IT neurons in layer 2/3 of the MOs, PL, and ORBm. Overview of the 17 IT neurons 7-23 in the MOs (A), 6 IT neurons 24-29 in the PL (B), and 7 IT neurons 30-36 in the ORBm (C). The yellow arrow indicates the injection site. (D) Projection strengths in the ipsilateral and contralateral target areas for each neuron in the PL and ORBm. (E–H) Statistical comparisons of neurons in the MOs, PL, and ORBm. Comparisons of axonal length (E), dendritic length (F), total number of axonal branches (G), and total number of dendritic branches (H). *p < 0.05; n.s., Represents no significant correlations.

